

2017 Reappraisal Values
The Harris Central Appraisal District is a regional agency responsible for appraising all property within the boundaries of Harris County for tax purposes. By law, the district must appraise property at the price for which it would sell on the open market as of January 1.
More information about 2017 reappraisal values for residential, commercial and business/industrial property is available through the Search option by searching for 2017 Market Trends.
Interactive GIS Maps
All maps represent a snapshot of GIS and Appraisal data as of April 2017 and are subject to change.
For help using our Interactive GIS Maps, please click here.
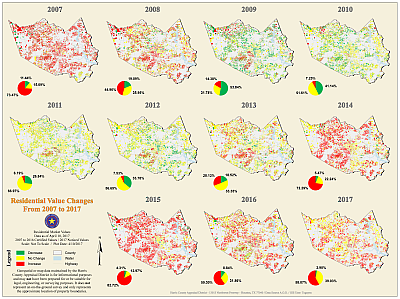
Boom, Recession, and Recovery - Residential
The following map depicts the value trends of residential property through an 11 year period from 2007 to 2017. When the recession hit in December 2007, home values throughout much of the county began to decline. The map clearly depicts this change as the red, indicating value increases, slowly fades from 2008 thru 2010. Over this same timeframe, the green, indicating decreases in value, becomes more prevalent. From 2011 thru 2012, property values remain mostly unchanged. The road to recovery begins in 2013 with property values rising, first in the southeastern part of the county and then county wide in 2014 and 2015. In 2016 and 2017, values start to stabilize as a greater number of values remain unchanged.
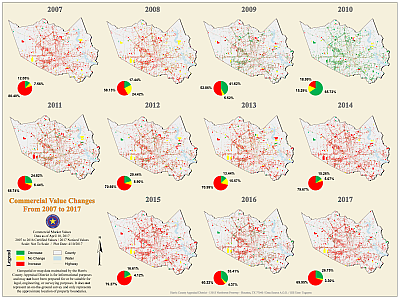
Boom, Recession, and Recovery - Commercial
Appraisal districts are required by law to appraise property at 100 percent of its market value as of January 1. This map follows and illustrates the market trend through the recession. Red specifies increasing values, green indicates decreasing values, and yellow shows no change in value.
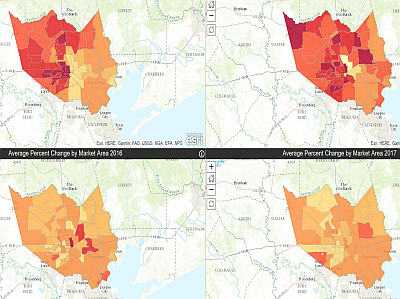
Multi-year Residential Average Percent Change by Market Area
This map shows a comparison of the average percent change and the average market value by market area for the previous four years. This includes the changes from 2013 to 2014, 2014 to 2015, 2015 to 2016, and 2016 to 2017. If you use the 2013-2014 map in the top left corner to zoom and pan, it will sync with the other three maps and all maps will zoom and pan together.
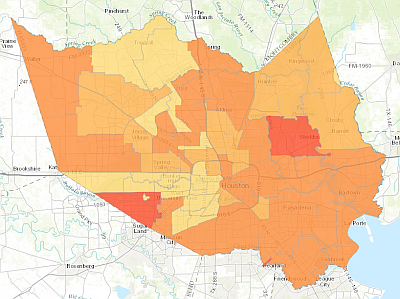
Average Percent of Change by Market Area
This map shows the average percent change in market value from 2016 to 2017 and the average market value by market area. The map also includes sales data for each market area with a breakdown by value strata.