

2022 Reappraisal Values
The Harris Central Appraisal District is a regional agency responsible for appraising all property within the boundaries of Harris County for tax purposes. By law, the district must appraise property at the price for which it would sell on the open market as of January 1.
More information about 2022 reappraisal values for residential, commercial and business/industrial property is available through the Search option by searching for 2022 Market Trends.
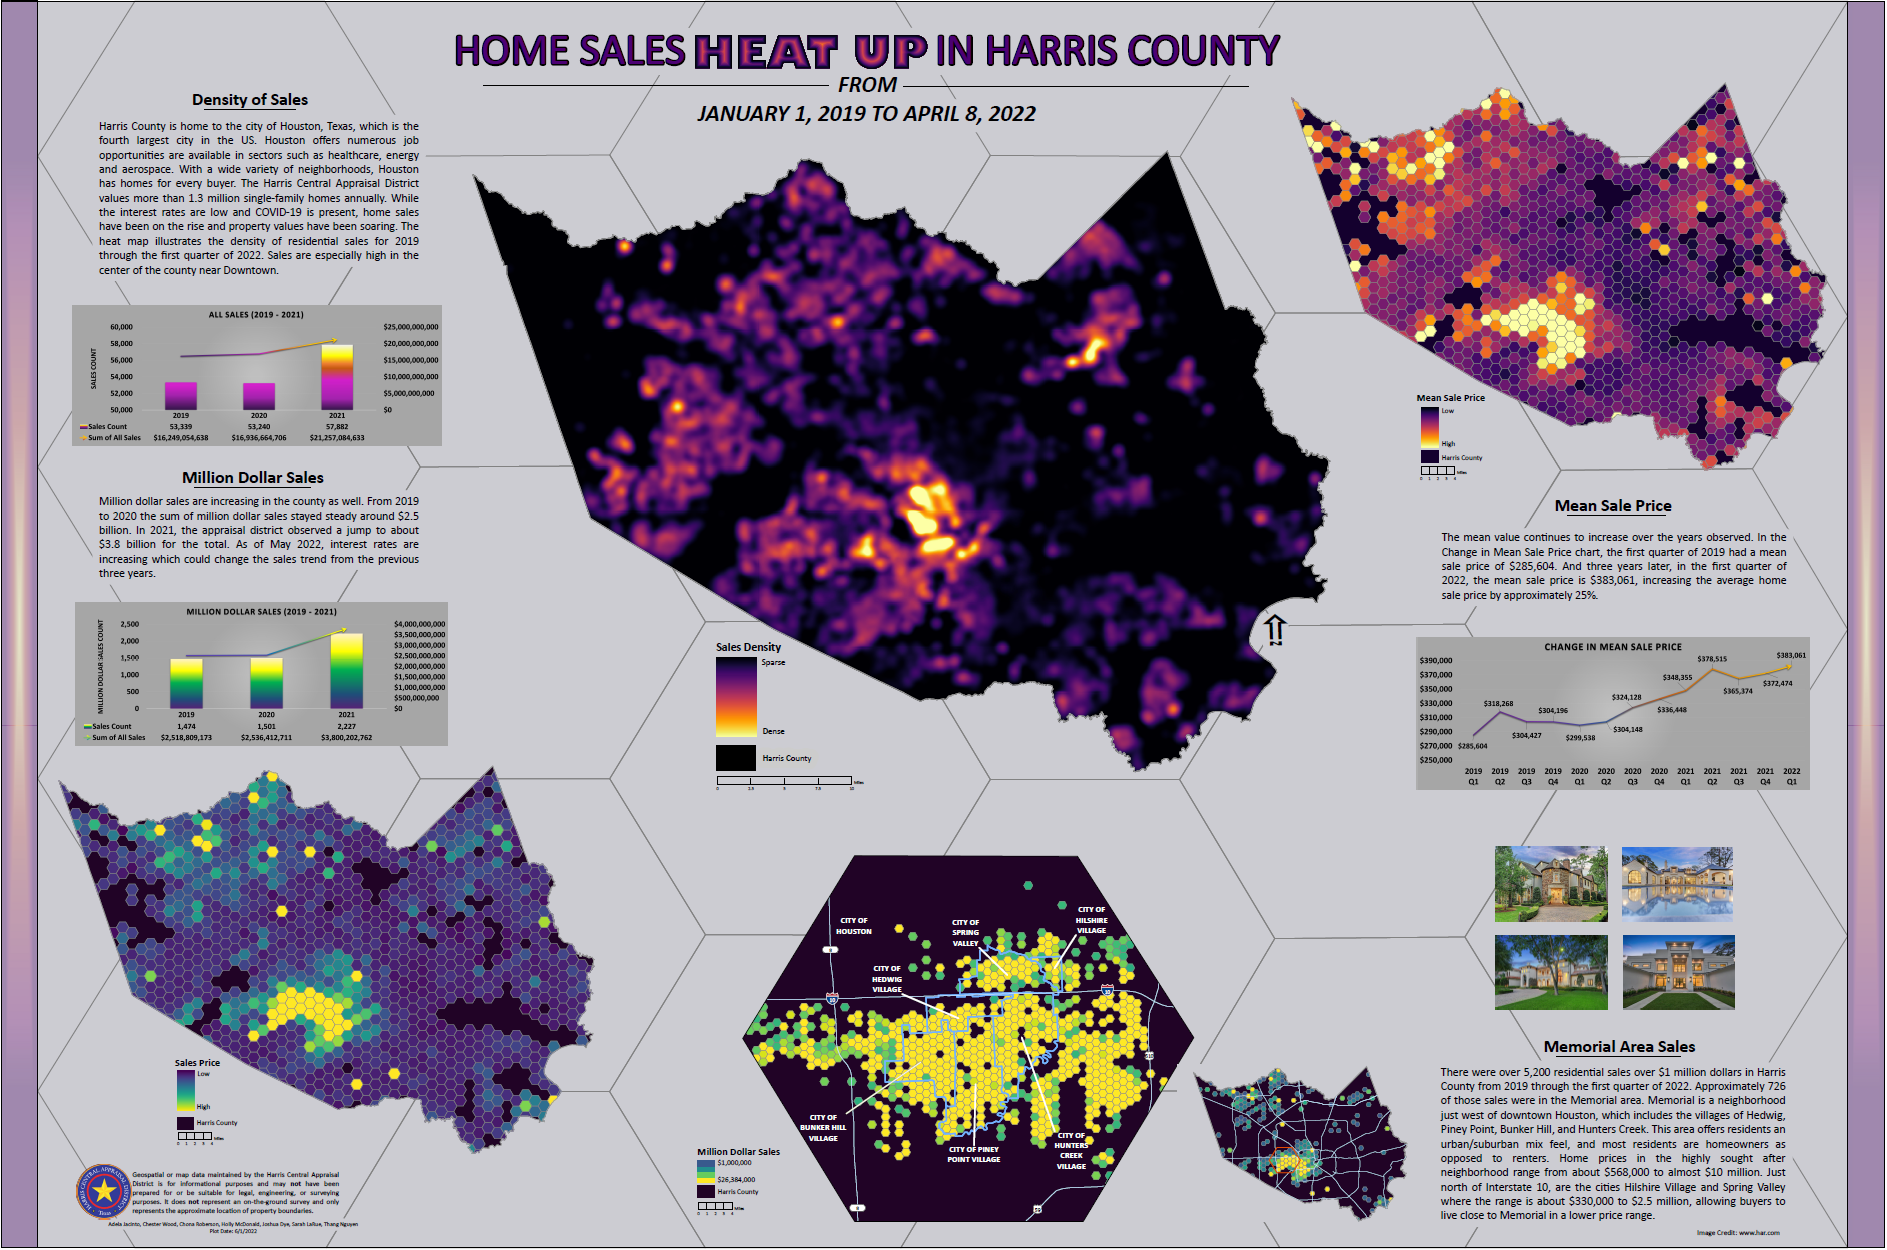
2022 Residential Sales
This map depicts the density of residential sales in Harris County from 2019 through the first quarter of 2022 showing the locations where the most sales occurred and areas where the highest value sales took place.
Interactive GIS Maps
All maps represent a snapshot of GIS and Appraisal data as of March 2022 and are subject to change.
For help using our Interactive GIS Maps, please click here.
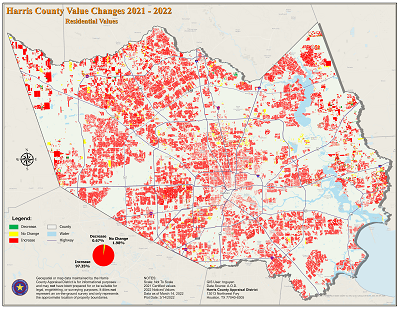
2022 Residential Values
This map depicts the residential value changes from 2021 to 2022. Green areas indicate decreases in value, yellow areas indicate no change in value and red areas indicate increases in value.
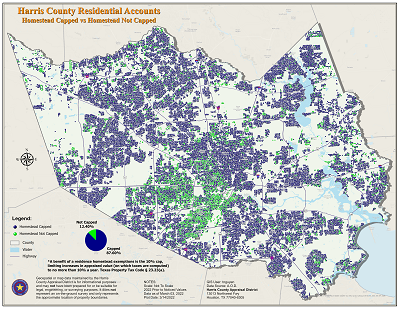
2022 Homestead Capped Accounts
This map depicts residential accounts that will reach the 10 percent cap in 2022 and those that will not reach the cap. A benefit of a residence homestead exemption is the 10% cap, limiting increases in appraised value (on which taxes are computed) to no more than 10% a year. Blue areas indicate capped accounts and green indicates those that will not reach the cap.
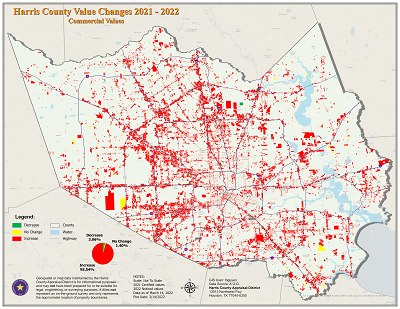
2022 Commercial Values
This map depicts the commercial value changes from 2021 to 2022. Green areas indicate decreases in value, yellow areas indicate no change in value and red areas indicate increases in value.
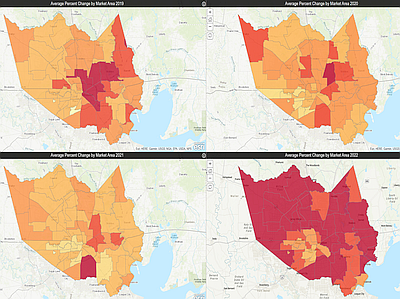
Multi-year Residential Average Percent Change by Market Area
This map shows a comparison of the average percent change and the average market value by market area for the previous four years. This includes the changes from 2018 to 2019, 2019 to 2020, 2020 to 2021, and 2021 to 2022. If you use the 2019 map in the top left corner to zoom and pan, it will sync with the other three maps and all maps will zoom and pan together.
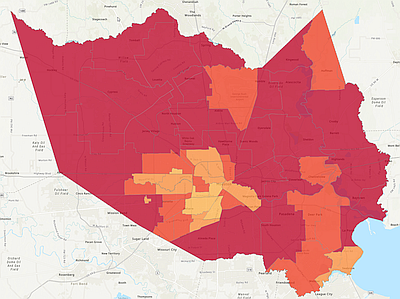
Average Percent of Change by Market Area
This map shows the average percent change in market value from 2021 to 2022 and the average market value by market area. The map also includes sales data for each market area with a breakdown by value strata.